
Bollinger Bands Master Class

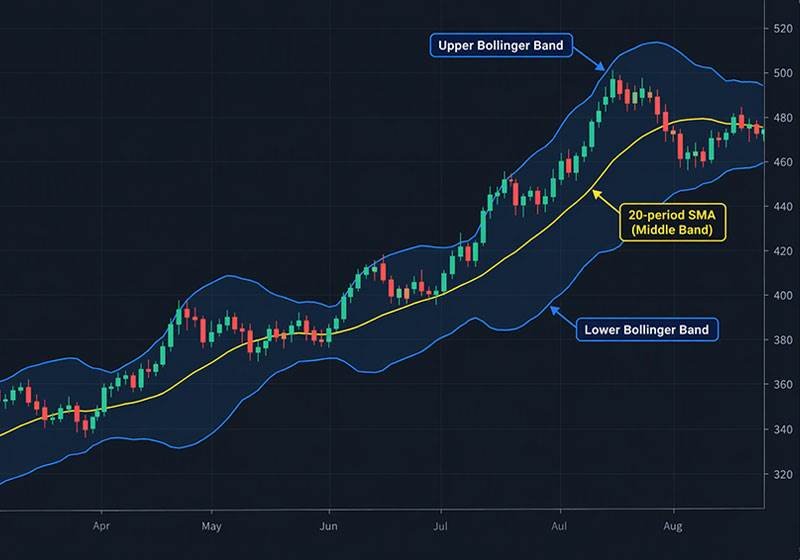
Introduction to Bollinger Bands
Bollinger Bands are among the most widely used technical analysis indicators in the stock market. Developed by John Bollinger, this indicator helps traders understand market volatility, identify relative price levels, and study potential trading opportunities.
Unlike indicators that use fixed price levels, Bollinger Bands adjust dynamically according to market volatility. When volatility increases, the bands expand. When volatility decreases, the bands contract.
Traders use Bollinger Bands in different markets, including stocks, indices, futures, forex and commodities. They can also be applied to different chart timeframes, from intraday charts to weekly charts.
However, Bollinger Bands should not be treated as an independent buy or sell signal. They work best when combined with price action, market structure and other suitable technical indicators.
In this master class, we will explore the structure, uses and important trading concepts of Bollinger Bands with practical examples.
1. Structure of Bollinger Bands
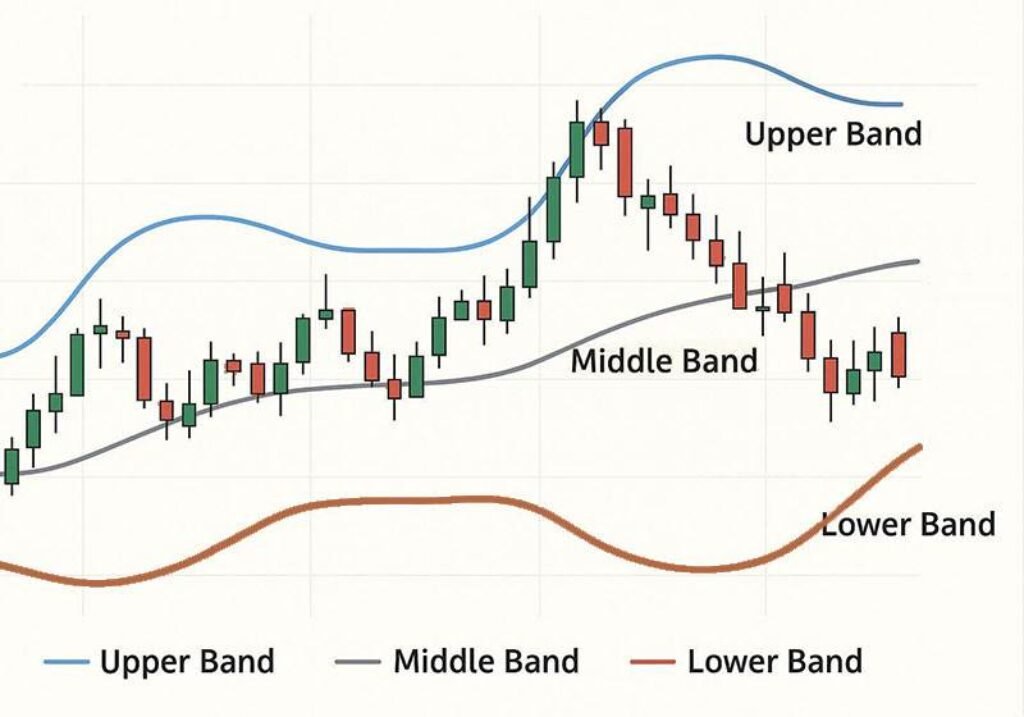
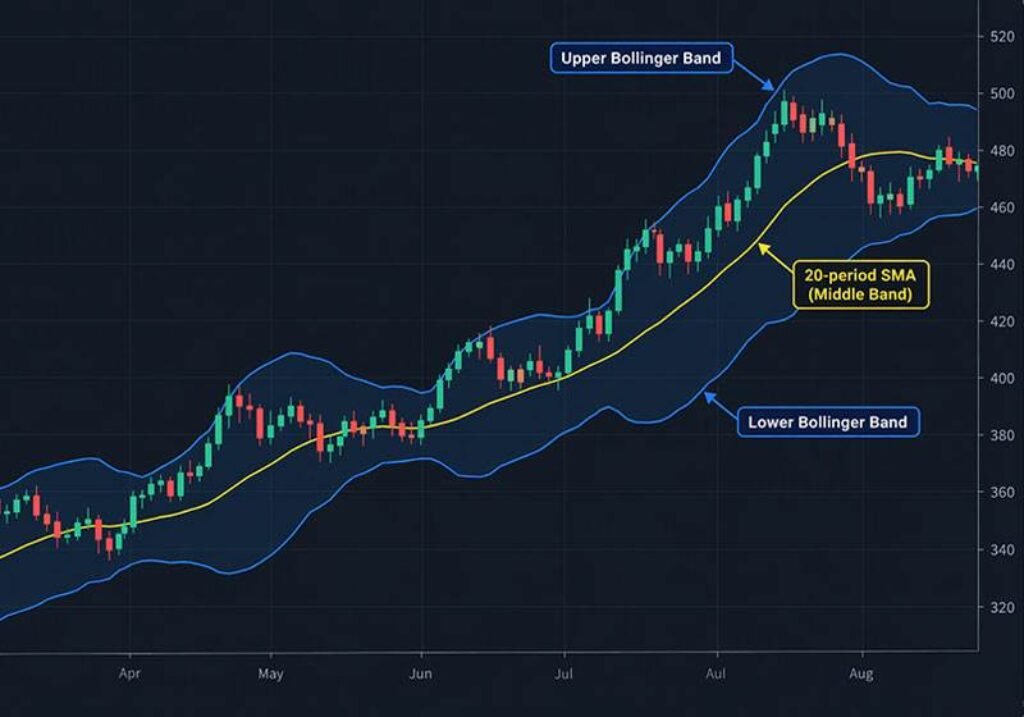
Bollinger Bands consist of three lines displayed around the price chart. Each line has a specific purpose.
The three components
1. Middle Band
The middle band is generally a 20-period Simple Moving Average (SMA). It represents the average price over the selected period and helps traders understand the intermediate price direction.
2. Upper Band
The upper band is calculated by adding two standard deviations to the middle band. It adjusts according to changes in market volatility.
3. Lower Band
The lower band is calculated by subtracting two standard deviations from the middle band.
Standard Bollinger Bands settings
The commonly used default settings are:
- Length: 20 periods
- Moving Average: Simple Moving Average (SMA)
- Standard Deviation: 2
- Price Source: Close
Bollinger Bands formula
Upper Band = SMA(20) + (2 × Standard Deviation)
Middle Band = SMA(20)
Lower Band = SMA(20) − (2 × Standard Deviation)
These are standard starting settings, not compulsory settings for every trading instrument or timeframe.
2. Uses of Bollinger Bands
Bollinger Bands are primarily used to study market volatility and the relative position of price.
Here are some of their important applications.
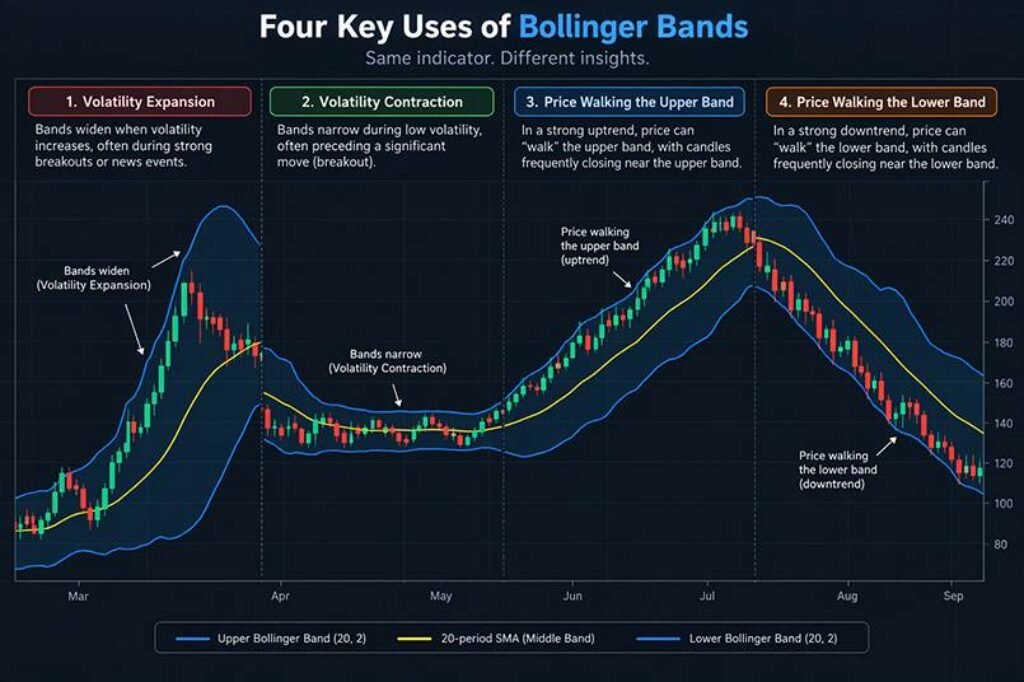
Measuring market volatility
The distance between the upper and lower bands changes according to volatility.
- Expanding bands generally indicate increasing volatility.
- Contracting bands generally indicate decreasing volatility.
- Narrow bands can help identify periods of market consolidation.
Identifying relative price levels
Price approaching the upper band is relatively high compared with its recent range. Price approaching the lower band is relatively low compared with its recent range.
This does not automatically mean that the market is overbought or oversold.
Studying trend strength
In a strong uptrend, price may repeatedly move along the upper band. In a strong downtrend, price may repeatedly move along the lower band.
This behaviour is sometimes called walking the bands.
Identifying trading patterns
Bollinger Bands can help traders study:
- Bollinger Bounce
- Bollinger Squeeze
- W-Bottom formations
- M-Top formations
- Price and indicator divergences
3. How to Insert Bollinger Bands into Your Charts
Most popular charting platforms provide Bollinger Bands as a built-in technical indicator.
Here is how to add them using TradingView.
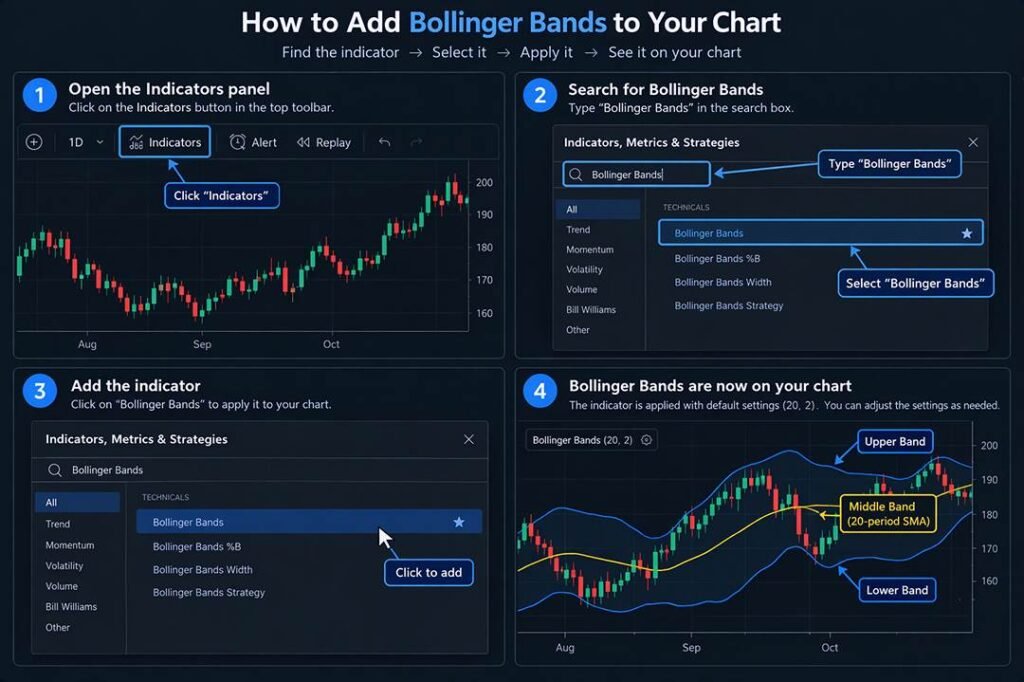
Step-by-step instructions
- Open the TradingView website or application.
- Select the financial instrument you want to analyse.
- Open its candlestick chart.
- Click the Indicators button.
- Search for Bollinger Bands.
- Select the built-in Bollinger Bands indicator.
- The indicator will appear over your price chart.
- Open its settings to customise the parameters.
Recommended starting settings
| Parameter | Setting |
|---|---|
| Length | 20 |
| Basis MA Type | SMA |
| Source | Close |
| Standard Deviation | 2 |
| Offset | 0 |
You can customise the colours, line thickness and background according to your preference.
Remember that different markets and trading timeframes may require different settings. Start with the standard parameters before experimenting with changes.
4. Overbought and Oversold Conditions in Bollinger Bands
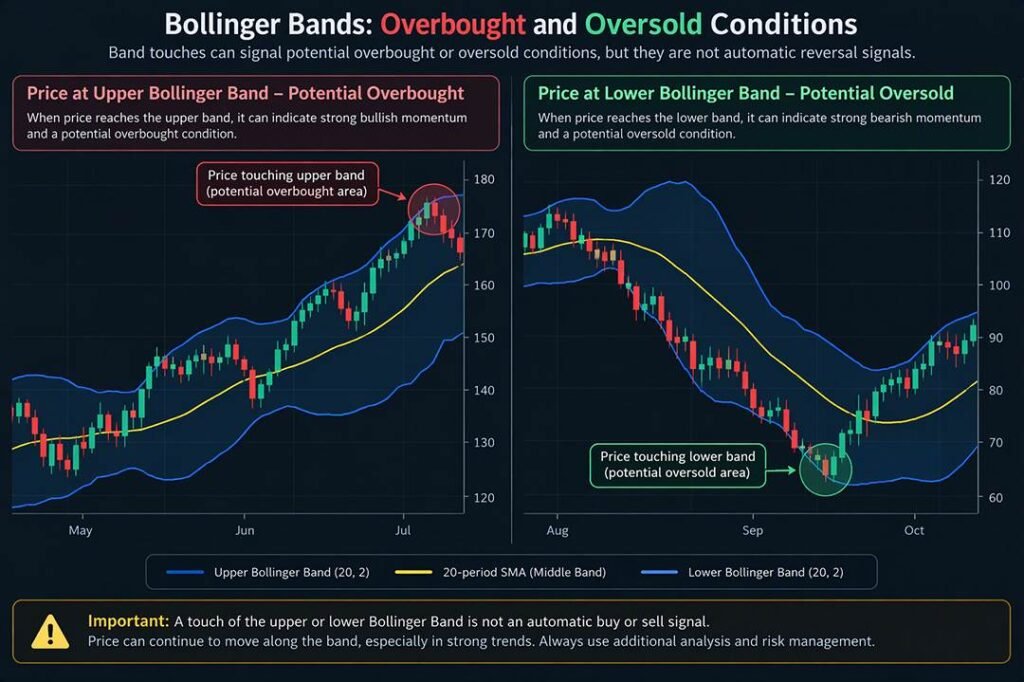
Bollinger Bands can help traders identify when price is relatively high or low compared with its recent trading range.
Overbought condition
When price reaches or moves beyond the upper band, it may indicate that price is relatively high.
Some traders interpret this as a possible overbought condition. However, an upper-band touch alone is not a sell signal.
During a strong bullish trend, price can continue moving along the upper band.
Oversold condition
When price reaches or moves below the lower band, it may indicate that price is relatively low.
Some traders interpret this as a possible oversold condition. However, a lower-band touch alone is not a buy signal.
During a strong bearish trend, price can continue moving along the lower band.
What should traders look for?
Instead of entering a trade immediately after a band touch, look for additional confirmation:
- Candlestick reversal patterns
- Support and resistance levels
- RSI or other momentum confirmation
- Changes in market structure
- Follow-through price movement
The important point is to understand the market context before making a trading decision.
5. Volatility Divergence in Bollinger Bands
Volatility divergence describes a situation where price movement and volatility behaviour do not appear to confirm each other.
One way to study this is through Bollinger Bandwidth, which measures the relative width of the bands.
For example, price may continue making new highs while the bands fail to expand meaningfully. This can suggest that the latest price movement is occurring without a comparable increase in measured volatility.
Similarly, price may make a lower low while volatility contracts.
These observations can alert traders to a possible change in market conditions, but they do not independently confirm a reversal.
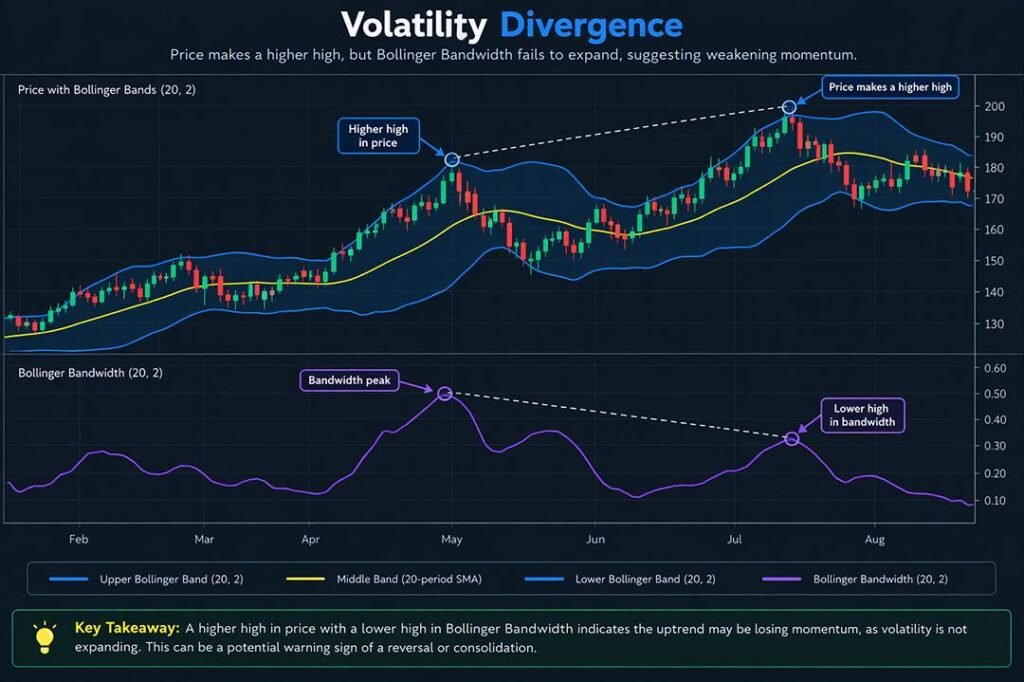
How to analyse volatility divergence
- Identify the direction of the current price trend.
- Observe whether the Bollinger Bands are expanding or contracting.
- Compare price swings with changes in Bandwidth.
- Look for supporting evidence from momentum indicators.
- Wait for price action to confirm any potential trading setup.
Do not confuse volatility divergence with traditional RSI divergence. RSI divergence compares price swings with momentum readings, whereas Bandwidth measures the relative width of Bollinger Bands.
6. Concept of Bollinger Bounce
Bollinger Bounce is a trading concept based on the tendency of price to move between the upper and lower bands during certain sideways or range-bound market conditions.
For example, price may approach the lower band, recover towards the middle band and later move towards the upper band.
This behaviour can provide potential opportunities for traders who study range-bound markets.
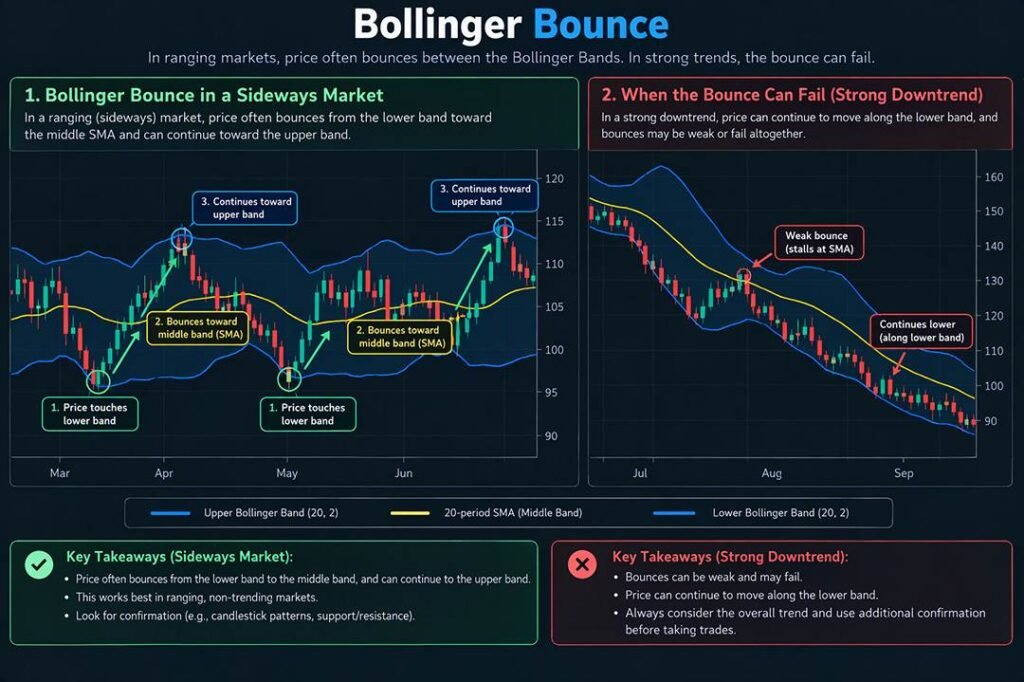
How does Bollinger Bounce work?
Lower band area: Price approaches the lower band and shows signs of a possible recovery.
Middle band: The middle SMA can act as a reference level during the price movement.
Upper band area: Price may continue towards the upper band, which can become a potential target in a range-bound market.
Important trading considerations
Bollinger Bounce is not suitable for every market condition.
In a strong trending market, price may continue walking along one band instead of reversing towards the middle.
Before considering a bounce setup, examine support and resistance, price action and overall market direction.
7. Concept of Bollinger Squeeze
The Bollinger Squeeze is one of the most popular concepts associated with Bollinger Bands.
A squeeze occurs when the upper and lower bands contract, indicating relatively low volatility compared with the instrument’s recent history.
This often happens when the market enters a consolidation phase.
Traders watch these periods because volatility can expand after a prolonged period of contraction.
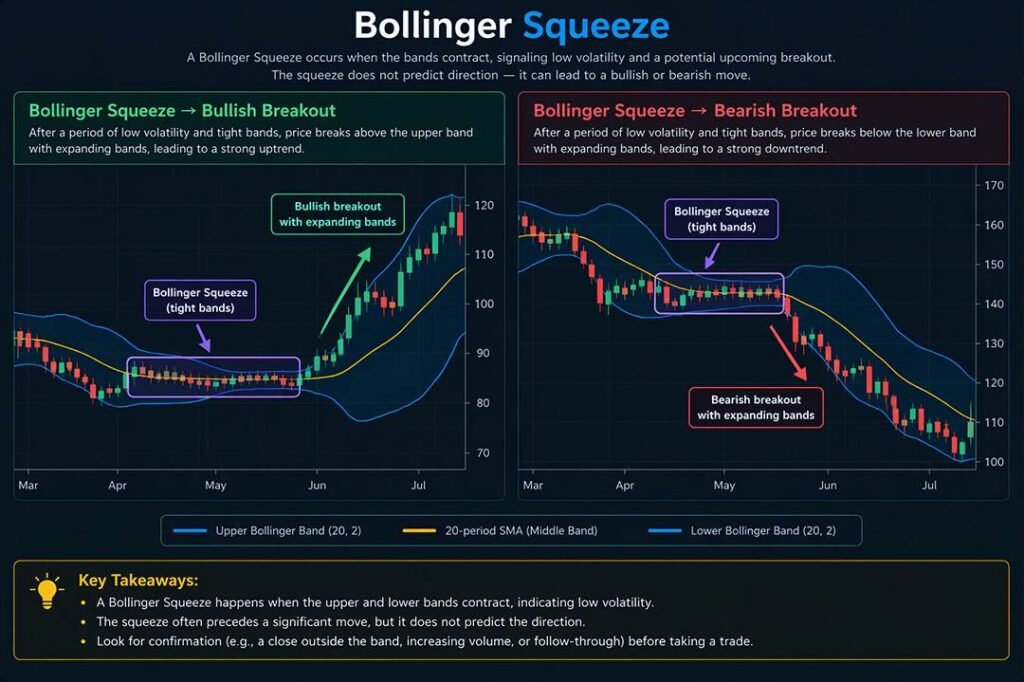
How to identify a Bollinger Squeeze
- Observe the distance between the upper and lower bands.
- Look for a noticeable contraction in band width.
- Compare the current width with its recent historical range.
- Wait for price to break out of the consolidation area.
- Look for confirmation from volume, price action or other suitable indicators.
Does a squeeze predict the breakout direction?
No.
A Bollinger Squeeze identifies a period of relatively low volatility. It does not predict whether the next major move will be bullish or bearish.
A breakout can occur in either direction, and false breakouts are possible.
Traders should wait for confirmation rather than entering simply because the bands have contracted.
8. W-Bottoms and M-Tops in Bollinger Bands
Bollinger Bands can help traders identify and study classic chart patterns such as W-Bottoms and M-Tops.
These patterns can provide useful information about potential changes in market direction.
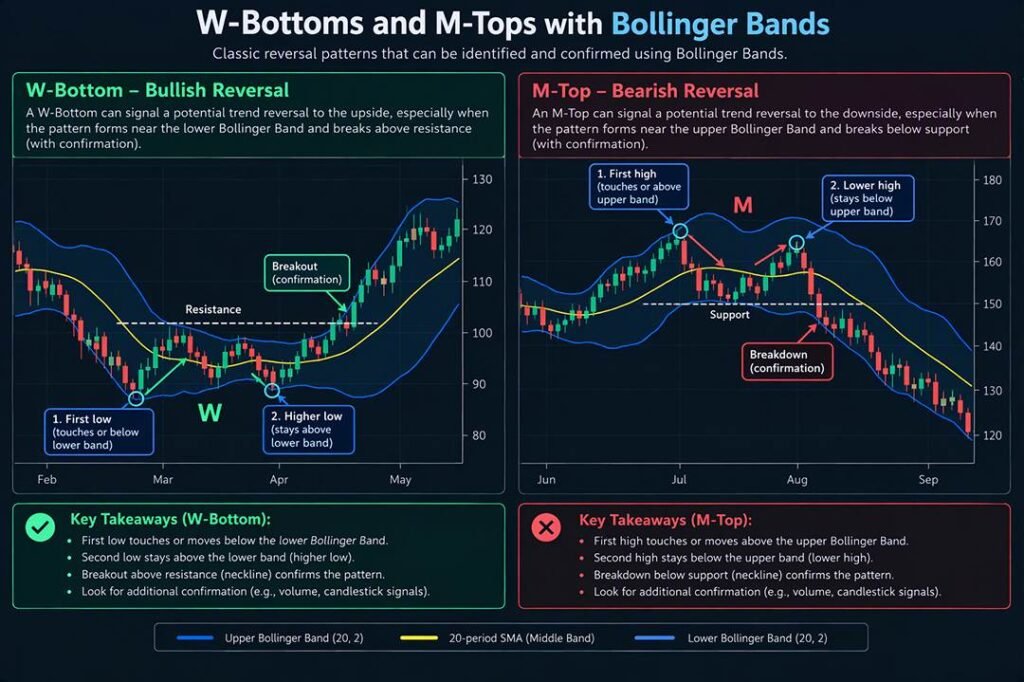
W-Bottom pattern
A W-Bottom is a potential bullish reversal pattern that forms through two price lows.
A common Bollinger Band interpretation involves four stages:
- The first low forms at or below the lower Bollinger Band.
- Price recovers towards the middle band.
- The second low forms above the lower band, showing a different relationship with volatility.
- Price moves above the resistance level formed between the two lows.
The move above the intermediate resistance level can provide additional confirmation of the pattern.
M-Top pattern
An M-Top is a potential bearish reversal pattern involving two price highs.
A common interpretation involves:
- The first high forms at or above the upper Bollinger Band.
- Price retreats towards the middle band.
- The second high forms below the upper Bollinger Band.
- Price breaks below the support level between the two highs.
This may indicate weakening upward momentum, although further confirmation is important.
Why are these patterns useful?
The relationship between price and the Bollinger Bands can help traders evaluate whether the second price swing is behaving differently from the first.
However, not every W-shaped or M-shaped price formation is a valid reversal pattern. Traders should also consider market structure, volume and confirmation levels.
Conclusion
Bollinger Bands are a useful technical analysis tool for understanding volatility, relative price levels and market behaviour.
From identifying overbought and oversold conditions to studying Bollinger Bounce, Bollinger Squeeze, volatility divergence, W-Bottoms and M-Tops, this indicator offers several ways to analyse price action.
However, successful technical analysis requires more than recognising indicator patterns.
Traders should combine Bollinger Bands with market structure, support and resistance, volume and suitable confirmation tools.
Start with the standard 20-period and 2-standard-deviation settings, practise on historical charts, and test your approach before using it in live trading.
Understanding the market matters more than following any single indicator.
Frequently Asked Questions
1. What are Bollinger Bands?
Bollinger Bands are a technical analysis indicator consisting of a middle moving average and two outer bands based on standard deviation. They help traders analyse relative price levels and volatility.
2. What are the best default Bollinger Bands settings?
The commonly used default setting is a 20-period Simple Moving Average with upper and lower bands at two standard deviations.
3. Are Bollinger Bands suitable for intraday trading?
Yes. Bollinger Bands can be applied to intraday charts, including 5-minute, 15-minute and hourly charts. The usefulness of the settings depends on the instrument and trading approach.
4. Does touching the upper Bollinger Band mean sell?
No. An upper-band touch is not automatically a sell signal. In strong uptrends, price can continue moving along the upper band.
5. What is a Bollinger Squeeze?
A Bollinger Squeeze occurs when the bands contract, indicating relatively low volatility. It can precede a volatility expansion, but does not predict breakout direction.
6. Can Bollinger Bands be used with RSI?
Yes. RSI can provide complementary momentum information. Traders should use indicators that measure different aspects of market behaviour rather than relying on several closely related indicators.
Further Reading
- Official Bollinger Bands Rules – John Bollinger
- Bollinger Bands – TradingView Help Centre
- Bollinger Bands – Fidelity Learning Centre
Educational disclaimer: This article is for informational and educational purposes only. Technical indicators do not guarantee trading results. Always assess risk and test trading methods before using real capital.